Fishbone Diagram
Posted by 6sigmastudy® on September 04, 2023 | Six Sigma Tools
Keywords: Six Sigma 6sigmastudy Six Sigma Yellow Belt (SSYB™) Six Sigma Green Belt (SSGB™) Six Sigma Black Belt (SSBB™) Lean Six Sigma Green Belt (LSSGB™) Lean Six Sigma Black Belt (LSSBB™) Free Articles Free Six Sigma Articles TQM Six sigma define dmaic dmadv

A Fishbone Diagram serves as a structured brainstorming instrument crafted to aid teams in identifying probable underlying causes of an undesired outcome. Its appellation is derived from its likeness to the skeletal structure of a fish. It is alternately recognized as a Cause-and-Effect Diagram or an Ishikawa Diagram, named after its originator.
Professor Kaoru Ishikawa, a Japanese statistician specializing in quality control at Tokyo University, is credited with the creation of the "Fishbone Diagram". In 1943, he employed the fishbone diagram concept at Kawasaki Steel Works to elucidate an intricate array of factors pertaining to a problem to a group of engineers.
A Fishbone Diagram is a graphical illustration that displays potential causes (input factors) connected to a particular effect (output outcomes). Essentially, it serves as a visual tool employed to identify the underlying cause(s) of a specific issue. It stands as a potent instrument for project teams entrusted with the exploration of fundamental triggers behind a predicament. It also proves valuable for teams who discover that their problem-solving approaches have become stagnant. Employing a Fishbone Diagram necessitates the team to examine all potential sources of errors and blunders, extending beyond previous notions or suspected causes that team members might hold.
Named for its resemblance to a fish's skeletal structure, the fishbone diagram is typically drawn horizontally, with the central box (resembling a fish head) on one end and labeled with the problem or effect being investigated. The primary branch (akin to a fish spine) originates from this box, while additional major branches extend outward, categorizing causes based on their characteristics.
Applications of fishbone diagram
The Fishbone Diagram, also referred to as the cause-and-effect diagram, is applicable in the following scenarios:
- To pinpoint potential causes of a problem
- To focus on a complex problem through collaborative team effort
- To aid in the creation of a product that addresses deficiencies in existing market offerings
- To uncover bottlenecks or vulnerabilities within a business process
- To analyze the interplay between factors influencing a specific process
- To verify that implemented corrective actions effectively resolve the problem
How to make a fishbone diagram?
- It starts with an issue or predicament, which is used as the "head" of the fish and concisely summarized.
- Subsequently, an elongated arrow is drawn, forming the backbone of the fish.
- From this point, the initial "bones" are extended directly from the backbone, taking the shape of slight diagonal lines from right to left. These are representative of the primary or overarching causes of the problem.
- Smaller bones containing supplementary details and contributing factors are created, emanating from each of these initial bones.
- Upon completion, a comprehensive overview of potential root causes for the addressed issue is offered by the fishbone diagram, enabling prioritization or identification of the most plausible ones.
Example of fishbone diagram
An example of a fishbone diagram is provided below:
In this case, let's imagine the problem is "Low Customer Satisfaction."
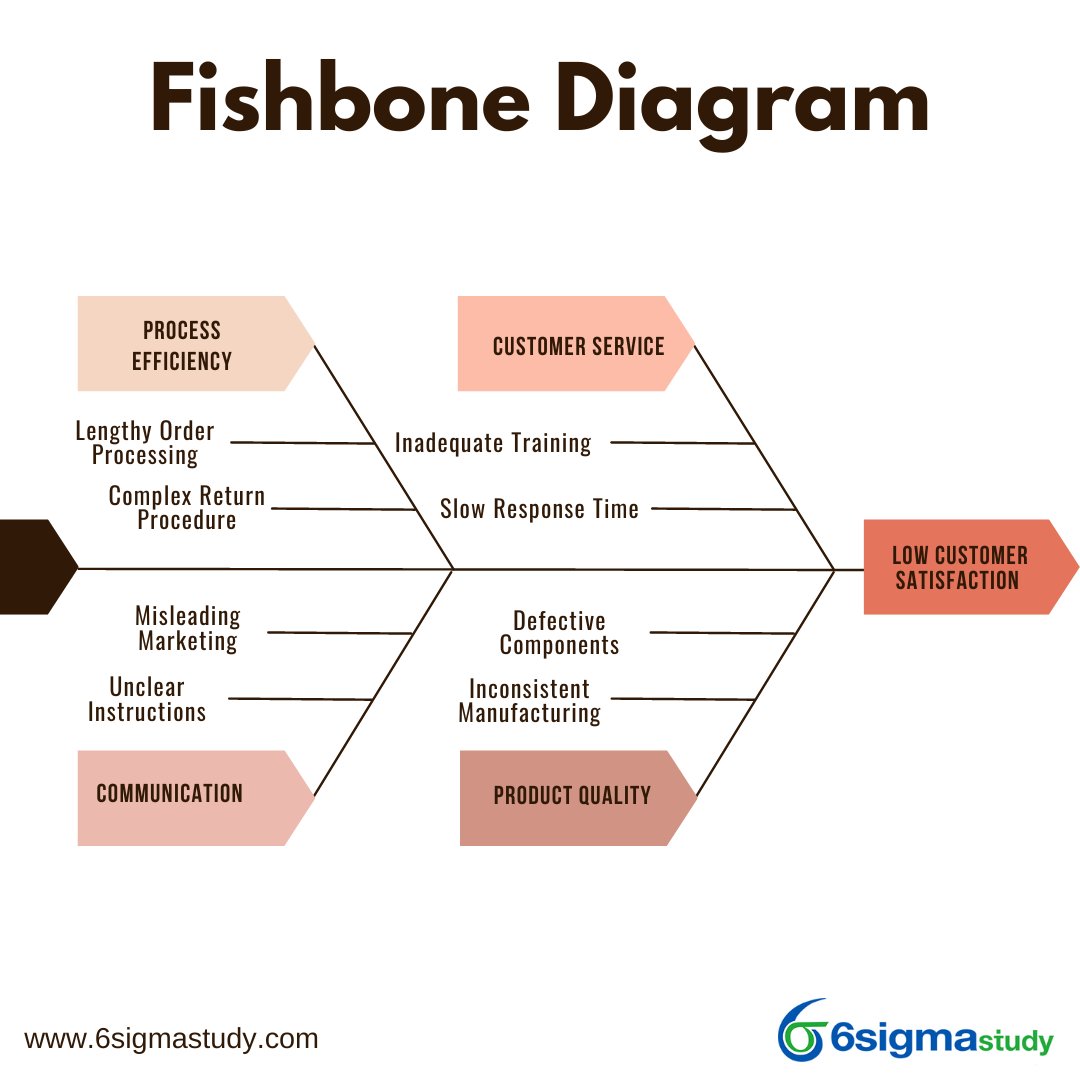
By analyzing these categories and their contributing factors, the team can gain insights into the potential root causes of the low customer satisfaction issue. This diagram helps visually map out the different factors that could be impacting the problem, guiding the team towards effective solutions and improvements.
In conclusion, the fishbone diagram stands as an asset in the toolkit of problem solvers and decision-makers across various fields. Its ability to visually represent multifaceted relationships among potential causes and effects empowers teams to tackle complex issues with clarity and methodical analysis. By offering a structured framework for brainstorming, categorizing, and prioritizing causes, the diagram facilitates collaborative efforts and encourages comprehensive problem understanding. Whether applied to quality control, process improvement, or creative innovation, the fishbone diagram remains a powerful tool that promotes a deeper understanding of problems and aids in crafting effective solutions.
For more such interesting articles on Six Sigma and its concepts, please click here